Processing a Larger Pair
Yesterday, I had my first poker round for a very long time with two good friends of mine. A couple of years ago, we started playing Texas Hold’em – as computer scientists, of course just because of the maths and statistics.
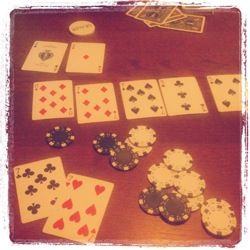
 During yesterdays game, we had a great hand facing a pocket pair of sevens a pocket pair of aces. By the flop and turn two more sevens came up providing me four of a kind and eventually the pot. Afterwards we had a nice chat about when and how to play a pocket pair as with three or less players on the table, one would play a pocket pair to the very end most of the times. However, with yesterdays hand in mind, I was quite interested in the statistics and the probability, my opponent might have a larger pair than 77.
I thought of this being a nice exercise for today visualizing this using Processing. As for any visualization, I needed some data. Therefore, I picked the corresponding table of probabilities from the Poker probability page on Wikipedia.
The visualization itself is straight forward, drawing he probabilities, axis and finally the labels. I decided to draw the axis after he probability curves simply to keep them on top of any other element on the canvas.
void draw()
{
    for(int col = 1; col < colCount; col++) {
      drawProbability(col);
    }
    drawAxis();
    drawLabels();
}
Finally, the result looks like the following. Indeed, you can see, that within a game of three people, there is only a 12% chance that someone would get a larger pair even if you hold a pocket pair of twos.

Of course, you could create such a chart using Microsoft Excel and there is no rocket science in this visualization. However, this was quite a nice exercise to re-activate my Processing skills. Positioning of labels is done relative to the size of the canvas and the length of the text as well as the color chosen for the number of opponents is chosen dynamically. The whole example is available at http//aheil.codeplex.com.